Showing posts with label US. Show all posts

Wednesday, 5 December 2012

What Can Happen with Gold If the Dollar Collapses?


-- Posted Tuesday, 4 December 2012 | Share this article | Source: GoldSeek.com


Today’s essay is the first one in our two-part commentary on U.S. debt and the dollar collapse.

On numerous occasions we have gone back in our commentaries to the year 1971 and U.S. President Richard Nixon’s decision to cut off the ties between the greenback and gold. Today, we revisit the topic once more and check what kind of implications it has for the price of the yellow metal.

Prior to 1971 the most prominent world currencies had been regulated by the Bretton Woods system. Under this agreement, the U.S. agreed to link the dollar to gold. This meant that any amount of dollars handed over by a foreign government or central bank would be exchanged for gold at $35 per ounce. Such an arrangement had a particularly important consequence for money creation. Namely, the U.S. government shouldn’t issue more paper money than it had physical gold to back this money up. In practice, it was rather improbable that all the dollars would have to be exchanged for gold at once, so the U.S. government in fact issued more money than it could have paid for with gold, but the main restriction was in place: debt numbers couldn’t be inflated to unsustainable levels.

In 1944 when the Bretton Woods system was introduced, the relation of U.S. debt to the official Treasury gold reserves stood at $319.90 per ounce of gold. This meant that there was $319.90 of borrowed money for every ounce of gold the U.S. had. With the price of gold at $35, a quick calculation shows that the U.S. gold reserves could have paid for about 10.9% of its debt. At first, it might seem that there was a lot of debt compared to gold assets. On the other hand, however, such a ratio was similar to reserves required from commercial banks by the regulator. In a way, the U.S. operated like a bank (with a lot of differences, of course).

By 1970, partly due to the Vietnam War, the U.S. began running consistent deficits. The government printed more dollars to meet its obligations and the amount of debt per ounce of gold surged to $1,172.56. The coverage of debt in gold went down to 3.1%. The ability of the U.S. to keep up to the promise to exchange dollars for gold was put into question. Nixon, fearing a situation in which foreign central banks would make a collective bank run on Fort Knox, decided to cease to exchange the dollar for gold and directly break the Bretton Woods agreement.

From that moment on, the dollar has been a fiat currency, that is a currency not backed by a physical asset, just by a promise of the government to accept payments (taxes) in it. But, as we’ve just seen, promises can be broken and right now the ability of the U.S. to pay its debts off in the future is also being put into question. To see why, take a look at the chart below.


Since 1970 U.S. debt has gone up from $370.9 bln to $16,159.5 bln, which is a more than 41-fold increase (!). Since 2000 gold has appreciated along with the ever sharper increase in debt. A similar chart was discussed in our commentary on gold as insurance.

Our next chart shows the rates of change (ROC) of both the U.S. debt and the average annual price of gold between 1920 and 2012.


The annual ROC of U.S. debt was in a general downtrend in the 1983-2000 period which was accompanied by poor performance of gold. Since 2000, the ROC of U.S. debt has been increasing again, which means that debt has been growing increasingly rapidly. This coincided with gold’s extraordinary performance during the last 10 years.

The U.S. Federal Reserve, led by Ben Bernanke, initiated three substantial rounds of what it calls quantitative easing (QE). In short, QE is a process in which the Fed buys government bonds and other assets from secondary markets with newly created dollars. Its (official) purpose is not to finance government deficits but rather to bring the U.S. economy back on the growth trajectory. Nonetheless, the effects of QE can be compared to those of printing enormous amounts of money. Just to give you an idea of how much debt the consecutive rounds of QE have so far created (approximate amounts):

  • QE1 (Nov 2008 – Mar 2010): $1.65 trillion
  • QE2 (Nov 2010 – Jun 2011): $600 billion
  • QE3 (Sep 2012 – ?): $40 billion per month.
As a matter of fact, Fed’s quest to provide the economy with more incentives has not stopped. The direct effect of QE on debt is reflected on the chart below.


In the period between January 2012 and November 2012 U.S. debt grew by 7.2%. There’s more to it: QE3 is an open-ended operation. This means that there is no limit on the amount of money the Fed can create and inflate the debt with within QE3. The purchases in the amount of $40 billion per month will continue as long as the Fed deems necessary.

The points mentioned above add up to a picture which is not at all rosy for the U.S. But it’s not apocalyptic either. Particularly for precious metals investors. Let us explain why.

It belongs to common sense that you can’t borrow money forever. Economics has a lot of intricacies and can be quite complicated at times but the basic rules are very simple. You borrow, you have to pay back. So if the government borrows too much and can’t pay it back, it will have to go bankrupt. The more debt it has, the worse its reputation is. People are less willing to put their money into treasury bills of a government with excessive debt. If the economy is shaky and the government is printing money, it damages its reputation but also makes the currency worth less and less. Hyperinflation is not a default nor bankruptcy in technical terms, but it is in practical terms. For the USD bond holders it will make little difference if they are not paid or paid something that is worthless.

In such an environment investors, motivated psychologically, turn to gold and silver. As Warren Buffet correctly pointed out:

“[Gold] gets dug out of the ground in Africa, or someplace. Then we melt it down, dig another hole, bury it again and pay people to stand around guarding it. It has no utility. Anyone watching from Mars would be scratching their head.”

But there’s one side of precious metals that is not covered by that quote. Gold and silver may be just lumps of metal but what makes them extremely interesting is the psychological association people have with them. Gold and silver have been used as currencies throughout the centuries. And people, for whatever reason, perceive them as valuable, particularly in times of economic turbulence. This alone stipulates that gold and silver prices may rise along with the worsening of the economic situation. And in case of the unlikely collapse of paper currencies, gold and silver could quite naturally come in as the base of a new monetary system.

The possibility we would like to highlight now is the default of the U.S. on its obligations and the demise of the dollar. In this scenario, a new currency system based on the gold standard is introduced. The financial collapse is usually perceived as Armageddon but doesn’t necessarily have to be one. Just imagine, even in case of the U.S. government defaulting on its obligations, the assets that the country has would remain in place. The buildings, cars and infrastructure would still be there, they wouldn’t melt down in the possible financial crisis.

A lot of property would change hands and there definitely would be turmoil, but it wouldn’t need to amount to a civil war. Take a look at Latvia, a country where the GDP between 2007 and 2009 shrank by 24%, where unemployment shot up to 30% in 2010. Where the government laid off 30% of the civil servants and cut payrolls by 40%. Latvia didn’t disintegrate.

So what implications for gold would a collapse of the U.S. dollar have? The next chart will aid us to analyze such an occurrence.


This chart presents the already mentioned relation of U.S. debt to Treasury gold reserves – the amount of debt per one ounce of gold – up to 2012. The red line represents U.S. Treasury gold reserves in metric tonnes, while the yellow line denotes the amount of U.S. debt in dollars per ounce of gold. The debt per ounce has visibly increased since 1971, accelerating around 2000 and even more around 2008. In 2012, there were $61,796.11 of debt per one ounce of gold owned by the U.S. government.

Now, if a new gold standard is introduced and the agreement works like the Bretton Woods system, the dollar (or whatever other currency) would be tied to gold. As noted earlier in this essay, at the introduction of the Bretton Woods agreement in 1944 the debt coverage for the U.S. stood at 10.9% (or $319.90 of debt per one troy ounce of gold). If the new system were based on similar assumptions with debt coverage at 10%, this would imply a fixed price of $6,179.61 per ounce of gold ($6,179.61 per ounce of gold divided by $61,796.11 of debt per one ounce of gold gives us coverage of 10%).

But is the dollar collapse all that likely? Or let us restate the question: if the dollar doesn’t collapse, does it still make sense to be invested in gold and silver? Bear with us until next week when we publish the second part of this commentary. Until then you can gain some more insight into why holding on to precious metals might keep you on the safe side by reading our essays on gold and silver as insurance and on gold and silver portfolio structure.

Thank you for reading. Have a great and profitable week!

Friday, 16 November 2012

Gold and the Cold War

 
-- Posted Thursday, 15 November 2012 | Share this article | Source: GoldSeek.com

There are now two great nations in the world, which starting from different points, seem to be advancing toward the same goal: the Russians and the Anglo-Americans... Each seems called by some secret design of Providence one day to hold in its hands the destinies of half the world.
         Democracy in America, Alexis de Toqueville, 1835

De Toqueville’s amazing prediction in 1835 about the destinies of Russia and the Anglo-Americans was every bit the equal to those made by his illustrious French predecessor, Michel de Nostradame.

In the 1830s, Russia was a czarist empire and the US had fought its war of independence from England only 60 years before. The idea of Russia and the Anglo-Americans ..starting from different points advancing toward the same goal.. called by some secret design of Providence..to [each] hold .. the destinies of half the world was an extraordinary prediction, especially in 1835.

Nonetheless, 110 years later, just as de Toqueville predicted, Russia and the Anglo-Americans each advancing towards the same goal would become enemies in what would become known as the Cold War, an extraordinarily costly decades-long battle for economic hegemony and world dominion in the second half of the 20th century.

In 1835, deToqueville called the two great nations, Russia and the Anglo-Americans. DeToqueville knew full well the difference between England and America. Nonetheless, de Toqueville made no mistake when he described the future Anglo-American alliance as one nation.

It was a prescient prediction of a coming, close relationship between England and the US, a relationship that would extend British geopolitical influence but would bankrupt America in the process and cost it its once great heritage as a beacon of freedom and liberty in the world.

EMPIRE, EMPIRE AND MORE EMPIRE

When de Toqueville made his prediction in 1835, both Russia and England were already empires. By the 18th century, the Tsardom of Russia had become the huge Russian Empire, stretching from the Polish-Lithuanian Commonwealth eastward to the Pacific Ocean.

The British empire, however, would become far larger and ultimately cover almost a quarter of the world’s land area. By 1922 it was estimated that England ruled 20% of the world’s population and was the largest empire in history.

The US, unlike Russia and England, had no interest in empire. Indeed, the democratic ideals of America were antithetically opposed to the imposition of power over others, let alone nations.

I have never been able to conceive how any rational being could propose happiness to himself from the exercise of power over others.
Thomas Jefferson

America’s participation in the Anglo-American pursuit of empire one century later would have catastrophic results for America. Cut loose from its moral anchor as a beacon of freedom, America would gain wealth and power but would lose its soul in the process; and, in the end, America would also lose much of its wealth and power as well.

Although, in the end, America would deny its democratic past to pursue the fruits of empire, it would not escape the costs, both financial and moral, in so doing:

Every ambitious would-be empire clarions it abroad that she is conquering the world to bring it peace, security and freedom, and is sacrificing her sons only for the most noble and humanitarian purposes.

That is a lie, and it is an ancient lie, yet generations still rise and believe it! If America ever does seek Empire, and most nations do, then planned reforms in our domestic life will be abandoned, States Rights will be abolished in order to impose a centralized government upon us for the purpose of internal repudiation of freedom, and adventures abroad.

The American Dream will then die—on battlefields all over the world—and a nation conceived in liberty will destroy liberty for Americans and impose tyranny on subject nations.
George S. Boutwell, (1818-1905), Secretary of the Treasury under President Ulysses S. Grant, Governor of Massachusetts, Senator and Representative from Massachusetts.

THE ANGLO-AMERICA ALLIANCE

In 1945, at the beginning of what is now known as the Cold War, England and America had become far more alike than America’s founding fathers could have foreseen; the central bank being the most egregious example.

Of all the English institutions that Founding Father Thomas Jefferson opposed, it was the central bank. Designed by bankers to transfer the profits of societal productivity, commerce and ingenuity to bankers and financiers via the mechanism of debt, the central bank was at the center of British power and wealth.

England’s central bank allowed England to wage war on credit, an advantage not shared by others; and as along as England’s armies and navies were victorious, the bankers’ debts were repaid, their wealth increased and England’s empire expanded.

England’s central bank allowed England to literally create money out of thin air. This monetary alchemy was possible as long as England (1) maintained confidence in paper money, (2) maintained the balance between credit and debt, and (3) kept its economy expanding.

In central bank debt-based economies, economic activity needs to expand or debt will overwhelm productive capacity; and when the growth of England’s empire began to slow in the late 1800s, England’s bankers realized they would soon need another base from which to continue their financial franchise.

America was ideal for England’s purposes; and despite Jefferson’s numerous warnings about central banks, in 1913 a consortium of private European bankers, US financiers and industrialists established the Federal Reserve Bank in the US, modeled after England’s central bank, the very institution that Thomas Jefferson so strongly opposed.

It was the establishment of the Federal Reserve Bank in America that allowed England to regain control of its former colony, the United States. Establishing a central bank was the first and only step necessary; for with a central bank established in America, private bankers would henceforth control America’s money supply and, ultimately, its political future.

Give me control of a nation’s money and I care not who makes the laws.
Mayer Amschel Rothschild (1744-1812)

RUSSIA, THE ANGLO-AMERICANS AND THE COLD WAR

In the 20th century, as England’s imperial power weakened, England’s grip on the US grew tighter; and by 1945, the US was more than eager to betray its democratic heritage in order to join England in the pursuit of world power.

After WWII, what Alexis de Toqueville had predicted in 1835 came true. Russia and the Anglo-Americans would compete for world dominion in what would become known as the Cold War.

The Cold War lasted from 1945 to 1990 when the USSR collapsed. It would appear the Anglo-Americans won and Russia lost. But, in truth, both sides lost; for the five-decade reign of Anglo-American dominance would cost the England and America their foundation of economic hegemony, i.e. the ability of their debt-based economies to expand ad infinitum.

The pursuit of global dominion would also cost America its vast gold reserves, once the largest monetary reserves in history. Maintaining a world-wide military force forced the US to end the gold-convertibility of the US dollar in 1971; and the removal of gold from the world monetary system allowed credit and monetary aggregates to grow at heretofore unprecedented rates.

The unrestrained growth of money and credit after 1971 led to the sequential growth and collapse of the three largest speculative bubbles in history: (1) the Japanese Nikkei in 1990, (2) the US dot.com bubble in 2000, and (3) the 25-year global credit bubble in 2008.

The subsequent inability of the Anglo-Americans to revive the credit and debt machine that had initially allowed it to achieve suzerainty over the East has now leveled the playing field between the East and the West; and, in this new playing field, the East and West are pursuing radically different strategies.

With its economic foundation threatened as never before, the West is doing everything in its considerable power to strengthen its now faltering economic foundation; and, gold, once viewed as necessary to maintain the stability of its paper money, is now viewed by Western bankers as a threat.

As confidence in the West’s confidence game of credit and debt wanes, investors are increasingly seeking the safety of gold. They have done so in every monetary and financial crisis in history and it is no less true today.

However, transferring wealth from paper assets, e.g. stocks and bonds, to gold threatens the leveraged asset base so necessary to the credit and debt ponzi-scheme that comprises the foundation of modern economies, i.e. debt-based capitalism.

It is perhaps appropriate that the two former communist antagonists to capitalist expansion, China and Russia, are now playing the exact opposite hand. As the latest iteration of ‘great game’ is being played out on the geopolitical stage, China and Russia are going for the gold.

THE EAST GOES FOR THE GOLD     

Since 2007, Russia has more than doubled its official gold reserves, the largest increase in reserves worldwide; and every month Russia buys about a half a billion dollars more. In 2012, China replaced India as the world’s top importer of gold and for the past five years China has led the world in gold mining production.

No gold mined in either China or Russia is sold on the open market. All gold mined in China and Russia stays in that country. Clearly, the East has a different strategy than the West and gold is a critical part of that strategy.

The West, however, is primarily concerned with protecting the economic system, i.e. capitalism, which allowed it to conquer and exploit much of the world for almost three hundred years. Such leverage is rarely come by and the fact that it may be ending has only redoubled Western efforts to save it.

The East has a much more sanguine outlook on the possible demise of capitalism. Capitalism is seen as a Western contrivance. Whatever replaces it will most likely involve gold and they’re getting ready.

My current youtube video, Exchange is Inevitable, Like Death, is a discussion with fellow author and long-time coin dealer, Ralph T. Foster. Most don’t realize the dangers of our times. They will. Unfortunately for most, it will be too late when they do.

Buy gold, buy silver, have faith.

Darryl Robert Schoon

Tuesday, 13 November 2012

Gold Bullion ETFs, Closed-End Funds, Or Gold Mining Stocks - Which Is The Best Investment?

Disclosure: I am long GGN and gold miner convertible securities traded on the TSX. (More...)

Many investors hold at least some gold in their portfolios as a form of insurance for market, currency, liquidity, or other form of financial collapse. Gold is a currency substitute, and has a constrained supply (the only increase is through mining new gold). Primitive societies, thousands of years ago, recognized this as an intrinsic store of value, and this has not changed. The value of gold should increase during times of uncertainty, so a long position should provide a hedge for a financial or political crisis.

We have alternative gold investments available. Which type of gold investment would be most beneficial, and under which circumstance? In order to facilitate this comparison, I will use the SPDR Gold Shares ETF (GLD) as the basis for all comparisons.

Option 1 - Gold Exchange Traded Funds (aka ETFs)
The gold ETFs will most closely track the actual price of gold. That said, there are a lot of "actual prices of gold," which is the reason for the descriptions. For example, the SPDR Gold Shares ETF (GLD) provide fractional ownership of gold bullion, so would be the one of the best alternative to track the current price.
This table provides the major U.S. gold ETFs for investors to consider for gold exposure and capital gains potential:

Exchange Traded Funds (ETFs) (Ticker)Description
Goldman Sachs Commodity Index (GSCI) Total Return Index ETF (GSP)ETN is linked to the S&P GSCI Total Return Index and provides you with exposure to the returns potentially available through an unleveraged investment in the contracts comprising the S&P GSCI plus the Treasury Bill rate of interest that could be earned on funds committed to the trading of the underlying contracts.
iShares COMEX Gold Trust ETF (IAU)The objective of the trust is for the value of the iShares to reflect, at any given time, the price of gold owned by the trust at that time, less the trust's expenses and liabilities. The trust is not actively managed.
PowerShares DB Gold Fund ETF (DGL)Based on the DBIQ Optimum Yield Gold Index Excess Return and managed by DB Commodity Services LLC. The Index is a rules-based index consisting of futures contracts on gold, and is intended to reflect the performance of gold. You cannot invest directly in an Index.
SPDR Gold Shares ETF (GLD)Gold Shares represent fractional, undivided beneficial ownership interests in the Trust, the sole assets of which are gold bullion, and, from time to time, cash. Gold Shares are intended to lower a large number of the barriers preventing investors from using gold as an asset allocation and trading tool.

These ETFs often have some cash on their books, or some paper-based gold-holdings (for liquidity). For this analysis, I have ignored the frictional holdings, and do not plan to analyze whether it is preferential for a fund to hold bullion or contract-based gold.

I thought to chart two of the funds to confirm that the gold ETFs track each other -- and therefore, represent the price of the underlying commodity (all charts are courtesy of CIBC Investors Edge). We can clearly see that 2 sample ETFs -- DGL and GLD -- move consistently with each other:

(click images to enlarge)

Gold ETFs would seem to provide an excellent investment alternative to track the price of gold. For convenience, I will use the SPDR Gold Shares ETF (GLD) as the benchmark (sort of a "gold standard") to compare other types of gold holdings. Given GLD as the basis for all comparisons, let's first expose a few basic statistics about this ETF, which validates its usefulness from a standpoint of size, liquidity, and expense ratio, and other metrics:

SPDR GoldStatisticComment
Average (Daily) Volume8,134,285Liquid
Recent Price162.60
52 Week High175.46Since 11/08/11 (-7.33%)
52 Week Low148.27Since 12/29/11 (+9.66%)
Managed Assets$72.06 BMega-cap
Expense Ratio0.40%
Average Bid Ask Ratio0.01%
Tracking Error0.90%
Concentration Risk100.00%Only gold

The ETFs track the commodity price, so they:
  1. Do not provide a yield, and as a yield-oriented investor, I would like an alternative.
  2. Are not a business (which may also be viewed as a strength, as it is not dependent upon management), which provides growth opportunities.
The next question to answer is whether other gold investments can provide similar "insurance" -- that they can accurately track the price of gold -- but provide other benefits, such as yield.

Option 2 - Closed-End Funds (aka CEFs)
Closed-End Funds (CEFs) can provide investors exposure to gold miners while providing an income stream. I have identified two of the most common (and larger-cap) U.S. funds in this space. Both are sponsored by GAMCO. In addition to Faircourt Gold Income Corp. (FRCGF.PK), there are other Canadian gold CEFs, but they are not traded in the U.S.:

Company (Ticker)Yield (%)Description
Faircourt Gold Income Corp. (FRCGF.PK)7.1%Canadian CEF (TSX:FGX): $36M cap; Issued at $9.05/unit, and trading around $8.12 on 2012-10-29; invest in gold exploration, mining or production on the S&P TSX Global Gold Index, while also providing monthly distributions.
GAMCO Global Gold Natural Resources & Income Trust (GGN)10.0%The Fund will attempt to achieve its objectives by investing at least 80% of its assets in equity securities of companies principally engaged in the gold industry and the natural resources industries. The Fund will invest at least 25% of its assets in the equity securities of companies principally engaged in the exploration, mining, fabrication, processing, distribution or trading of gold or the financing, managing, controlling or operating of companies engaged in "gold-related" activities. In addition, the Fund will invest at least 25% of its assets in the equity securities of companies principally engaged in the exploration, production or distribution of natural resources, such as gas, oil, paper, food and agriculture, forestry products, metals and minerals as well as related transportation companies and equipment manufacturers.
GAMCO Natural Resources, Gold & Income Trust (GNT)10.6%Less gold orientation than GGN. The Fund's primary investment objective is to provide a high level of current income from interest, dividends and option premiums. The Fund's secondary investment objective is to seek capital appreciation consistent with the Fund's strategy and its primary objective. Under normal market conditions, the Fund will attempt to achieve its objectives by investing at least 80% of its assets in securities of companies principally engaged in the natural resources and gold industries.
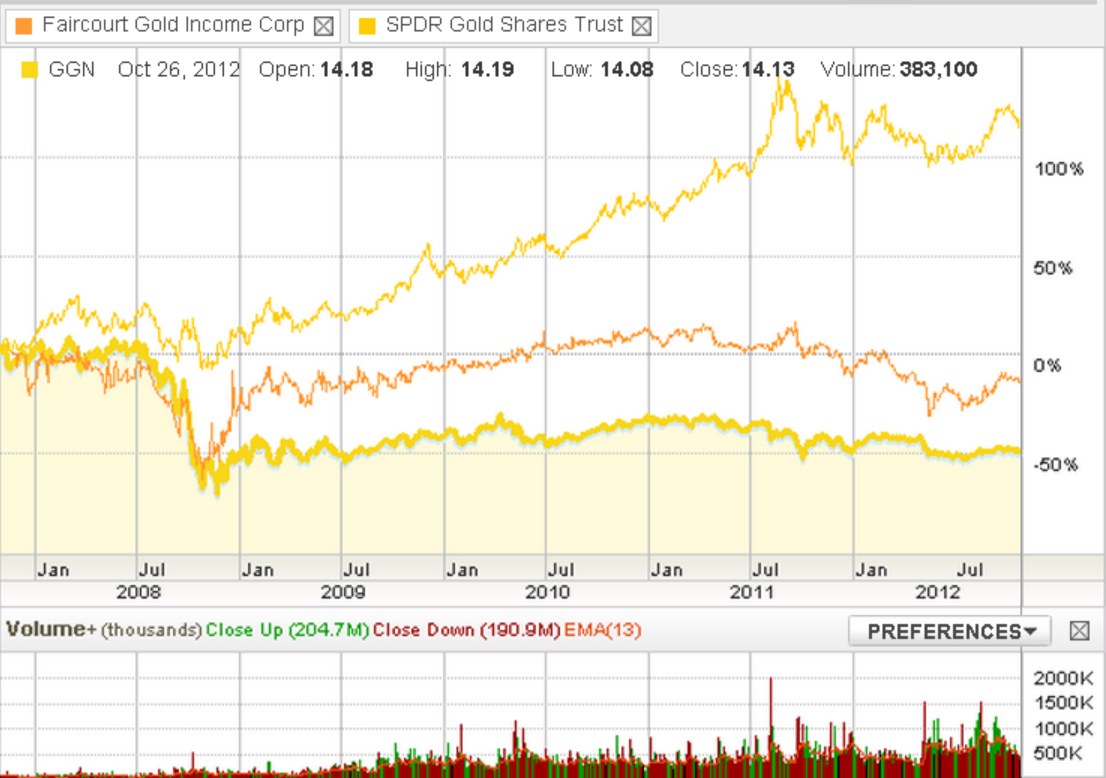
In order to determine the degree to which a Closed-End Fund of gold miners would track the price of gold, I compared two of the CEFs with the SPDR Gold Shares ETF (GLD). For clarity, the two bottom lines are the CEFs, and the gold ETF is the top (performing) line. As well, it is clear that neither the GAMCO Global Gold Natural Resources & Income Trust (GGN) nor the Faircourt Gold Income Corp. (FRCGF.PK) track the price of gold in the last two years over this five-year timeframe. There are certain alignments in some of the peaks and troughs, but it appears that the CEFs do not provide a direct correlation to the market price of gold.


We must conclude that if you are seeking capital gains, rather than yield, and want to track gold prices more directly, then the Closed-End Fund alternative is probably NOT your best choice. You should probably be holding a gold bullion ETF or mutual fund. Otherwise, CEFs offer the only very high yield for gold holdings, which perhaps compensates for the price difference of the commodity.
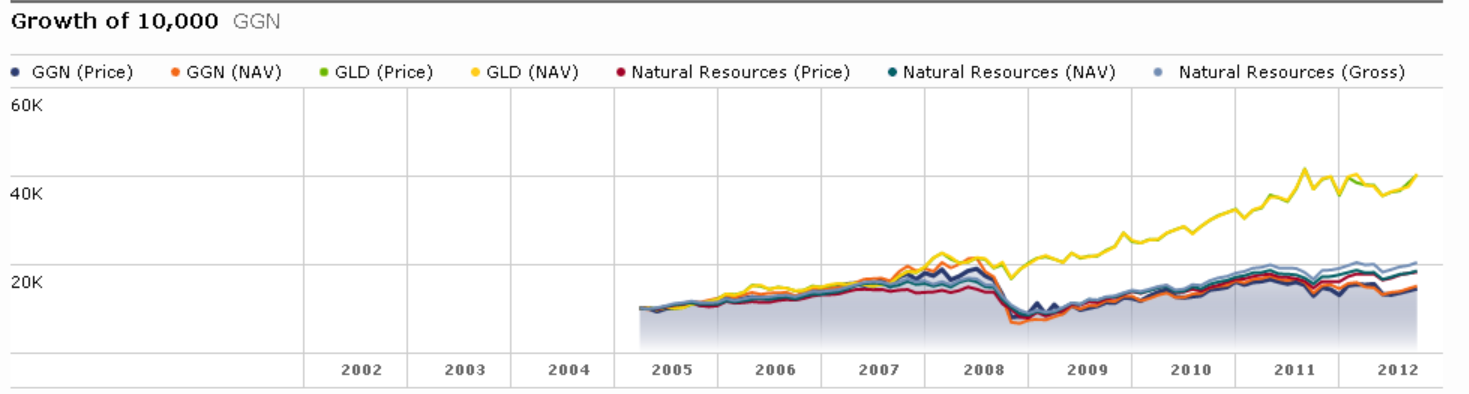
I also examined the total return of GAMCO Global Gold Natural Resources & Income Trust (GGN) using Morningstar's Performance (Total Returns) graph, which reports the cumulative value of $10k invested, including distributions. With its 10% yield, this Closed-End Fund provides the investor with a substantial total return -- which is an upward-sloping line, Price alone (which plummeted in both this and the previous chart) -- does not indicate the total return. Despite the difference, which is a better recovery for the CEF total return, the gold-tracking SPDR Gold Shares ETF (GLD) remains the top line.

There is one important caveat -- the CEFs with managed distributions (such as the three examples in the table) often rely upon the return of capital to fund the distributions -- several SA articles (another example) and reader comments explore this issue in detail and explain the trade-offs. This may influence your perception of the benefits of the gold-miner CEF alternative.

Option 3 - Gold Mining Companies
I have assembled a sample of large and mid-cap gold producers that are represented in many of the gold-mining funds.
Company (Ticker)Yield (%)Description
Agnico-Eagle Mines (AEM)1.6%Canadian-based gold producer with operations in Canada, Finland and Mexico, and exploration and development activities in Canada, Finland, Mexico and the U.S.
Anglogold Ashanti (AU)1.7%AngloGold Limited is the largest gold producer at 7 million ounces a year, with reserves of 126 m oz. The company has operations in six countries on three continents, some of which are joint ventures, as well as exploration activities in 10 countries.
Barrick Gold (ABX)2.0%Barrick Gold Corporation is a leading international gold producer with low-cost mines in North and South America.
Gold Fields Ltd. (GFI)4.0%Gold Fields Limited is one of the world's largest unhedged gold producers with operating mines in South Africa, Ghana, and Australia.
Goldcorp (GG)1.2%Goldcorp is a North American-based gold producer engaged in exploration, extraction, and processing of gold. The company's primary asset and key value driver is its Red Lake Mine, which is the largest producing gold mine in Canada.
Gold Resource Corp. (GORO)3.6%The Company has 100% interest in four potential high-grade gold and silver properties in Mexico's southern state of Oaxaca.
Iamgold (IAG)1.6%It holds a 38% stake in the Sadiola Gold Mine and a 40% stake in the Yatela Gold Mine. Both are located in Mali, West Africa.
Kinross Gold (KGC)1.6%The Company's mines are located in the regions of South America, North America, West Africa and Russia.
Randgold Resources (GOLD)0.3%It has to date discovered the 7 Moz Morila deposit in southern Mali, the plus 5 Moz Yalea deposit in western Mali and the 3 Moz Tongon deposit in the Cote d'Ivoire. It has a portfolio of prospective exploration projects across Africa in Mali, Cote d'Ivoire, Senegal, Burkina Faso, Ghana and Tanzania.
Semafo Inc. (SEMFF.PK) TSX:SMF1.0%A mining company with gold production and exploration activities in West Africa. The Company operates three gold mines: the Mana Mine in Burkina Faso, the Samira Hill Mine in Niger and the Kiniero Mine in Guinea.
Yamana Gold Inc. (AUY)1.4%Yamana Gold is a Canadian gold producer with significant gold production, gold and copper-gold development stage properties, exploration properties and land positions in all major mineral areas in Brazil.

One general heads-up about mining stocks -- despite their U.S. and Canadian listings, many have operations in Africa and South America -- and some of these countries have unstable political environments, and/or regimes that are unfriendly to mining companies. Therefore, we need to recognize that for these, there are risk trade-offs in exchange for potentially greater (yield and capital gains) returns.

My previous articles -- "Hedge For Inflation And Deflation With Precious Metals Convertible Securities - Part 1 - U.S. Securities" and "Hedge For Inflation And Deflation With Precious Metals Convertible Securities - Part 2 - Canadian Securities" -- propose that investors employ precious metals convertible preferred shares and debt, in order to provide yield with gold exposure. This is my alternative because few gold mining companies pay dividends, and most of those that do pay a "whopping" dividend of less than 2%.

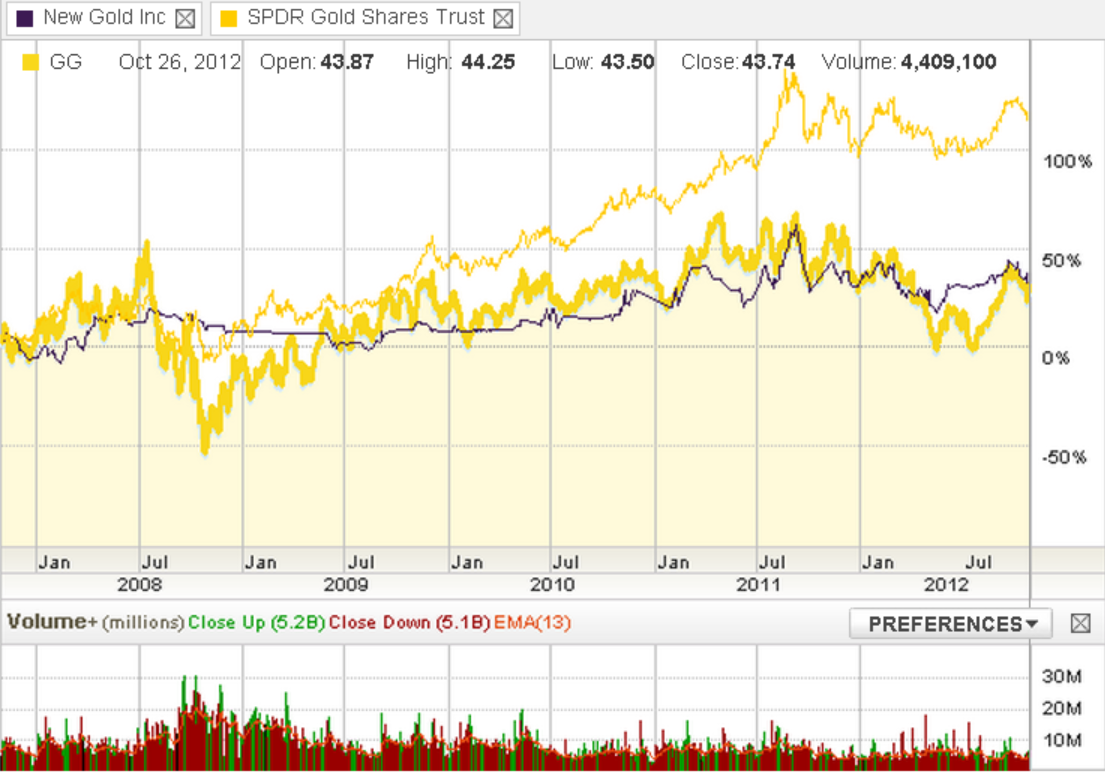
Will a gold miner, or a convertible bond of a gold miner, align with the price of bullion -- as tracked by the SPDR Gold Shares ETF (GLD)? I used Goldcorp (GG) -- the largest gold miner, and New Gold's (NGD) convertible debenture (TSX: NGD.DB), one of the largest gold convertibles in the marketplace -- as representative securities:


Again, the gold-tracking ETF is the top line. Goldcorp (the bottom line) seems to have a rough alignment with the market movement of gold prices, but there are differences. Perhaps it is just my interpretation, but the gold-miner seems to have deeper troughs and lower highs than the commodity ETF.

Although some of the gold-commodity spikes seem to briefly lift the prices of the New Gold (NGD) convertible security, it does seem to be sticky around its long-term price (of $120 per $100 face value), which provide a strong support level. Perhaps one can generalize this, and suggest that there is some price appreciation with the increase of gold prices, and that price-drops are mitigated by the fixed-income nature of the convertible instrument. Overall, convertible prices are less volatile, and are not closely correlated with the price of gold. Again, the yield compensates the holder of a convertible bond, and the ability to convert the debt into gold-miner equity can provide a gold-like hedge -- at least it should as the redemption/conversion date approaches.

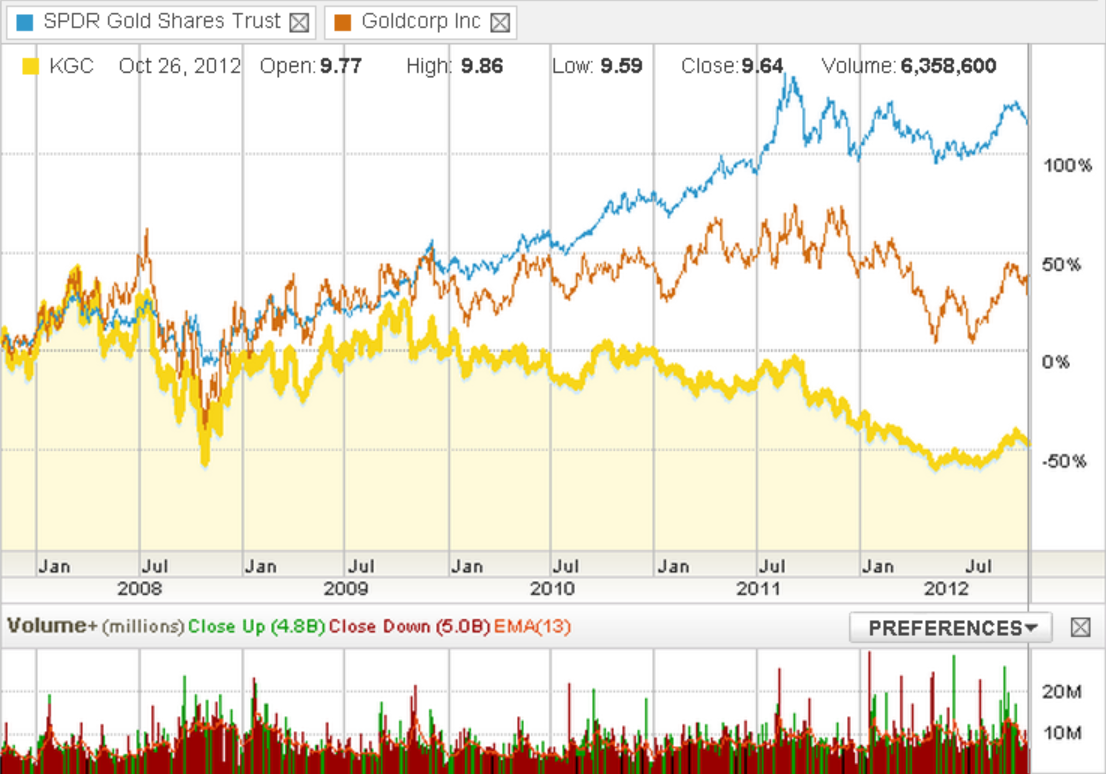
The big challenge of using gold miners as a proxy for the price of gold bullion is that the performance of the company is perhaps as great, or greater, a driver of the share price, as the price of gold. For example, Kinross Gold (KGC) has had a string of unsuccessful mining projects and a stock-price meltdown. The conclusion is that one must expect variability of a gold-miner's share price with the miner's profitability -- not simply the market price of gold (or anticipated market price of gold). Again, GLD, the gold-tracking ETF, is the top line; Goldcorp (GG) the middle; and Kinross (KGC) the lower line:


The conclusion that we can draw is that individual gold-miner results trump the market price of gold; although if a miner is performing relatively well (such as Goldcorp), it may approximately trend with the gold commodity.

Comparing the Alternatives
The last step is to compare all three gold investment options. Given the very different nature of the three gold investment options, one would expect some divergence in their graphs.

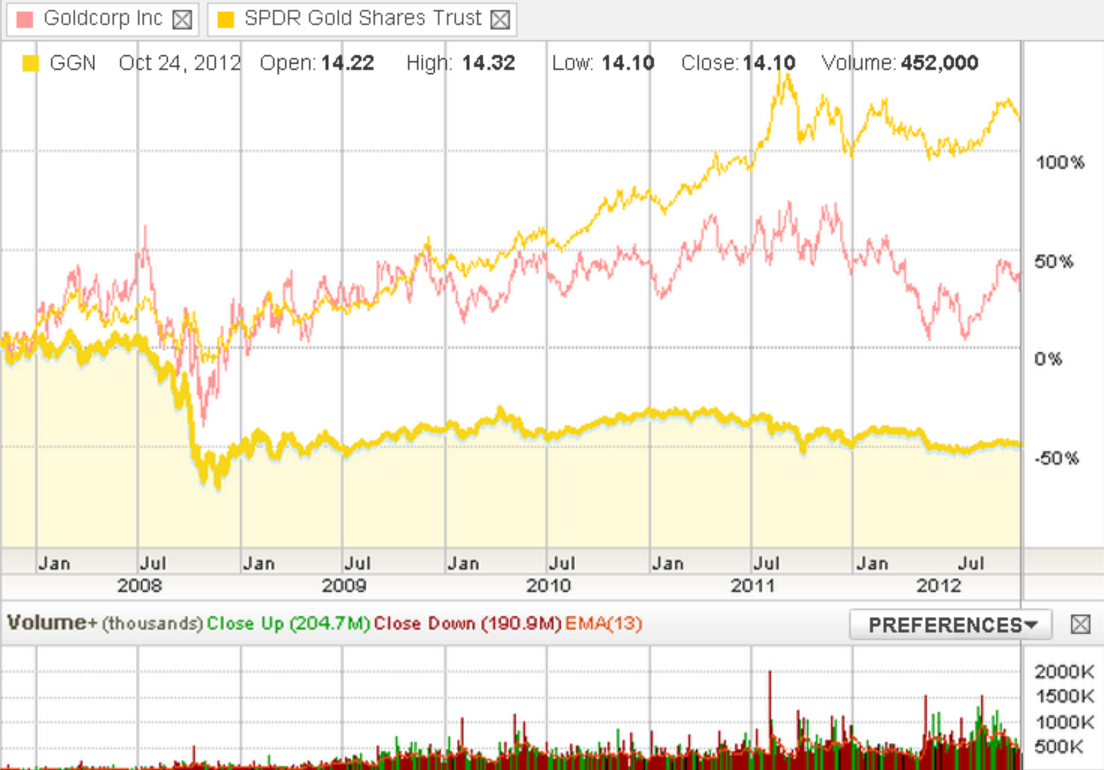
There is no surprise here. The graph compares how one representative gold miner (Goldcorp - GG - pink) tracks against one CEF (GGN - the bottom line) and the SPDR Gold Shares ETF (GLD - the top line):


Clearly, there are other factors than simply the market price of gold (represented by the GLD ETF) that determine the market price for the gold miner and the CEF. Of course, the CEF and miner trend-lines exclude the return associated with their yields, which again, in the case of GGN, is substantial (10% per year).

I have not explored these alternatives, although they may be viable and cost-effective for some investors:
  1. Directly purchasing gold ingots and coins and holding them in a safety deposit box (or the bank acting as custodian of this asset type for you). I have tried this with silver in the past. This is complex and expensive to do for small holdings, subject to retail margins on the transactions, and not as liquid or convenient as holding securities.
  2. Mutual funds with gold holdings (or gold miner holdings) are available to investors, but the additional fees (particularly in Canada, where fees are often 2% - 3%) make this a less attractive alternative to many investors.
  3. To generate income, it is possible to sell options on many of the gold funds and mining companies. In one of my long-ago articles about gold, a reader, Smarty_Pants, provided an excellent comment on how to use options to generate yield. I recognize that this is potentially remunerative, but have not identified a mechanism to value a string of puts and calls (and possibly have the options exercised).
The matrix, below, can help you decide which of the three options best meet your investment goals:
Option/AttributeOption 1 - Gold ETFsOption 2 - Gold CEFsOption 3 - Gold Mining
DescriptionHolds gold (and may hold gold options)Portfolio of gold minersIndividual mining co.
AdvantagesTracks gold and/or future contracts
Has outperformed other alternatives
Can pay high (managed) distributionsReturn based on business and margin of gold mining
DisadvantagesNo yieldMay vary indirectly with the price of gold -- there are other factors (such as non-gold holdings) impacting the security priceManagement decisions, local jurisdictions, and other factors may have a bigger impact than gold price

We must conclude that the choice of gold investment depends on your investment goals, but the consistent five-year top performer is a gold bullion ETF -- in this case, SPDR Gold Shares ETF (GLD).

I would like to make one last disclaimer. My sample size is small -- I have generally provided one example from each of the categories, although I did model more than one when testing my hypotheses. If you are wondering how your favorite mining company or CEF behaves against the fluctuations in the price of gold, there are many websites that facilitate this comparison. My request is that if you learn anything that relates to this, perhaps you can share it?

For disclosure, most of my holdings in this sector are not traded in the U.S. Personally, as a yield-oriented investor, I have chosen Options 2 and 3 (via convertible securities) for my gold holdings. That said, it is clearly not the best choice when benchmarked against GLD.

Friday, 2 November 2012

Gold retreats below $1,720/oz, U.S. jobs data eyed

Gold retreats below $1,720/oz, U.S. jobs data eyed


Gold bars are displayed at a gold jewellery shop in the northern Indian city of Chandigarh May 8, 2012. REUTERS/Ajay Verma 
 
LONDON | Thu Nov 1, 2012 1:30pm EDT
 
(Reuters) - Gold prices eased a touch on Thursday as the dollar firmed, but moves were muted as investors remained focused on U.S. employment data due on Friday for clues on monetary policy.

A jump in U.S. stocks after well-received economic data lent some support to gold, while European shares were also bolstered by a well received earnings report from Royal Dutch Shell (RDSa.L). <FRX/>

Spot gold was down 0.2 percent at $1,716.45 at 1643 GMT, while U.S. gold futures for December were down $2.29 an ounce at $1,716.20.

Gold prices rallied to nearly $1,800 an ounce in early October after the Federal Reserve announced new monetary stimulus measures, which tend to help gold by fuelling fears of inflation and maintaining pressure on interest rates.

It has also benefited from fears that the United States could be facing a 'fiscal cliff' if lawmakers fail to avert looming tax hikes and cuts to public spending, which are due to kick in at the start of next year.

"Before the elections on Tuesday, the non-farm payrolls will be quite a big deal," Natixis analyst Bernard Dahdah said. "(Further out), we have the fiscal cliff in the next two months. If you have more issues with that, that will definitely send the price of gold higher."

With the extent of the Fed's latest stimulus measures largely dependent on the health of the U.S. labor market, Friday's non-farm payrolls data will be closely watched.

Analysts in a Reuters poll expected the economy to have added 125,000 jobs last month, with the unemployment rate seen at 7.9 percent, against 7.8 percent the previous month.

"The ongoing (U.S. stimulus) programme Operation Twist (exchange of bonds with short maturities to ones with long maturities) will expire by the end of the year, thus forcing the Fed to decide whether to pump further liquidity into the economy or not at its December meeting," Commerzbank said in a note.

"That means disappointing data is likely to cause speculation about an increase of QE3 towards year-end, thus putting pressure on (the dollar), while surprisingly positive results reduce this likelihood."
GOLD MAY REBOUND
Technical analysis suggested that spot gold may rebound marginally to $1,736 an ounce, as indicated by a falling channel and a Fibonacci retracement analysis, according to Reuters market analyst Wang Tao.

ScotiaMocatta said in a note that the precious metal was challenging resistance at $1,721. "Support is at $1,693, the 38.2 percent retracement of the May-to-October uptrend, followed by $1,661, the 50 percent retracement level," it added.

On the physical markets, traders in India took to the sidelines, waiting for a further price correction to buy. Those betting on higher prices are expecting Indian demand to rise this month as festival season peaks during Diwali.

"Gold prices ... may be helped by a pickup in Indian festive buying ahead of Diwali and the Indian wedding season," HSBC said in a note.

Russian gold companies increased gold production by 3.1 percent in the first nine months of 2012 compared with the same period of last year, an industry lobby said.

Among other precious metals, spot platinum was up 0.2 percent at $1,563.75 an ounce, and palladium was up 1.5 percent at $609.22 an ounce. Silver was up 0.2 percent at $32.26 an ounce.

Anglo American Platinum (AMSJ.J) said it did not have sufficient staff at its strike-hit mines in South Africa to operate as workers had not yet accepted a company offer to reinstate sacked miners and return to work.

The world's top platinum producer said it was losing an average of 3,694 ounces of platinum per day due to the strike, which is now in its seventh week. To date, 141,640 ounces of platinum have been lost, it said.